

RIO Press Articles |
| Globe Asia - Jun 2011 |
| Globe Asia - Currency Wars Nov 2010 |
| Player Magazine - Born Trader 2009 |
RIO ARC Reports |
| ARC GBP Report Jul2025 |
| ARC USD Report Jul2025 |
| ARC USD Report Apr2025 |
| ARC GBP Report Mar2025 |
| ARC USD Report Mar2025 |
RIO Platinum USD/GBP Reports |
| RIO Platinum USD Oct2025 |
| RIO Platinum USD Mar2025 |
| Platinum Report Feb2025 |
| RIO Platinum GBP Oct2024 |
| RIO Platinum USD Jun2024 |
RIO Silver Lining Reports |
| Silver Lining GBP Jul2025 |
| Silver Lining Report Feb2025 |
| Silver Lining Report Feb2025 |
| Silver Lining USD Report Oct2024 |
| Silver Lining GBP Report Jun2024 |
RIO Currency Concept Reports |
| Currency Concept Report Apr2025 |
| Currency Concept Report Apr2025 |
| Currency Concept Report Oct2024 |
| Currency Concept Report Jul2024 |
| Currency Concept Report Dec2023 |
RIO Property Reports |
| RIO Property Oct2025 |
| Property Report Apr2025 |
| Property Report Mar2025 |
| Property, a focus on Scotland Oct24 |
| Property Report Oct2024 |
RIO Regular Reports |
| Regular USD Report Oct2025 |
| Regular USD Report Jul2025 |
| Regular USD Report May2025 |
| Regular GBP Report May2025 |
| Regular GBP Report Apr2025 |
General RIO Club Reports |
| RIO Smart Money Oct2025 |
| Britain not so Great for some |
| Gold Report Nov2023 |
| Gold Jan2023 |
| End of Year Summary 2022 |
General Investment Reports |
| Will the Fed cut interest rates? |
| Gold |
| The UK Budget |
| The Election is Over! |
| Gold Report Mar2024 |
RIO Charity and Sponsorship |
| RIO Sponsors ATGT 2025 |
| RIO Sponsors GTC Marbella 2025 |
| RIO Sponsors Garden Party Spain |
| RIO Sponsors FUFGT 2025 |
| RIO Sponsors German Open Cup 2025 |
Health Wealth and Happiness

Download the historic RIO magazines
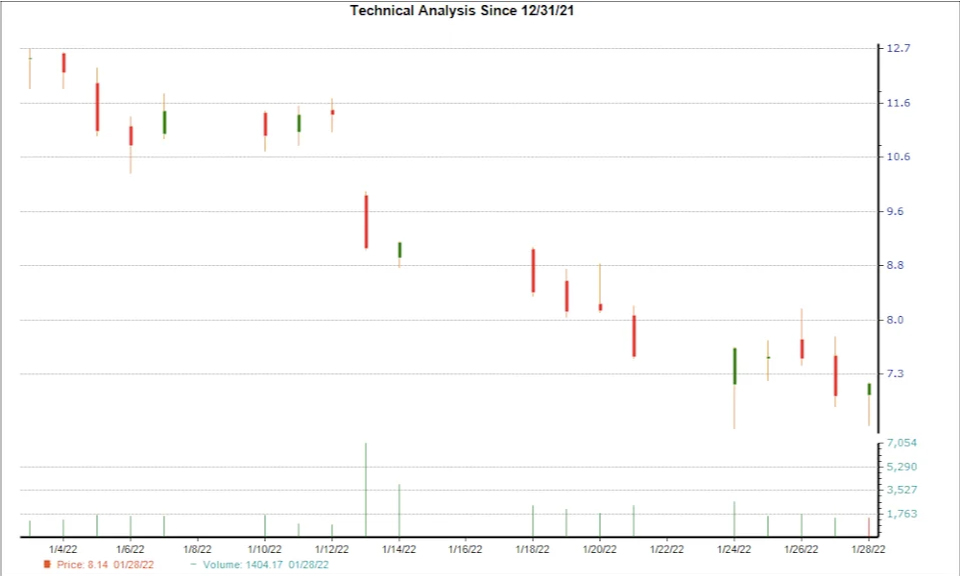
Virgin Galactic (SPCE) Could Find Support Soon, Here's Why You Should Buy the Stock NowShares of Virgin Galactic (SPCE) have been struggling lately and have lost 19.7% over the past two weeks. However, a hammer chart pattern was formed in its last trading session, which could mean that the stock found support with bulls being able to counteract the bears. So, it could witness a trend reversal down the road. While the formation of a hammer pattern is a technical indication of nearing a bottom with potential exhaustion of selling pressure, rising optimism among Wall Street analysts about the future earnings of this company is a solid fundamental factor that enhances the prospects of a trend reversal for the stock.
Understanding Hammer Chart and the Technique to Trade It This is one of the popular price patterns in candlestick charting. A minor difference between the opening and closing prices forms a small candle body, and a higher difference between the low of the day and the open or close forms a long lower wick (or vertical line). The length of the lower wick being at least twice the length of the real body, the candle resembles a 'hammer.' In simple terms, during a downtrend, with bears having absolute control, a stock usually opens lower compared to the previous day's close, and again closes lower. On the day the hammer pattern is formed, maintaining the downtrend, the stock makes a new low. However, after eventually finding support at the low of the day, some amount of buying interest emerges, pushing the stock up to close the session near or slightly above its opening price. When it occurs at the bottom of a downtrend, this pattern signals that the bears might have lost control over the price. And, the success of bulls in stopping the price from falling further indicates a potential trend reversal. Hammer candles can occur on any timeframe -- such as one-minute, daily, weekly -- and are utilized by both short-term as well as long-term investors. Like every technical indicator, the hammer chart pattern has its limitations. Particularly, as the strength of a hammer depends on its placement on the chart, it should always be used in conjunction with other bullish indicators. Here's What Makes the Trend Reversal More Likely for SPCE An upward trend in earnings estimate revisions that SPCE has been witnessing lately can certainly be considered a bullish indicator on the fundamental side. That's because empirical research shows that trends in earnings estimate revisions are strongly correlated with near-term stock price movements. Over the last 30 days, the consensus EPS estimate for the current year has increased 0.6%. What it means is that the sell-side analysts covering SPCE are majorly in agreement that the company will report better earnings than they predicted earlier. |